In this chapter we will address 3 core question:
what are variables?
where does data come from?
why is uncertainty unavoidable?
These question may sound simple, but they are the heart of statistics and data science.
When we collect data, we are not just writing down numbers. We are measuring quantities that can change, observing outcomes that were unknown before measurement, and trying to understand the process that produced them.
To make this clear, we will answer these three questions one by one. By the end of this chapter, we will see how variable, feature and random variable are closely connected.
What is a variable
A variable is something that can take different values. It represents a quantity we measure from the world, such as height, age, or time.
The key idea is A variable describes what we are measuring, not value itself.
height = 160
print(height)
160
From Variable to Data
When we measure a variable, we get a number, that number is data.
The key idea:
variable = concept
Data = observed value
if we measure many times, we collect multiple data points.
height = [156,167,189,155,178]
print(height)
[156, 167, 189, 155, 178]
Visualizing
Each observation can be seen as a point, if we measure two variables(e.g., height & weight), we can plot them.
Key points:
Data can be viewed as points in space.
<function matplotlib.pyplot.show(close=None, block=None)>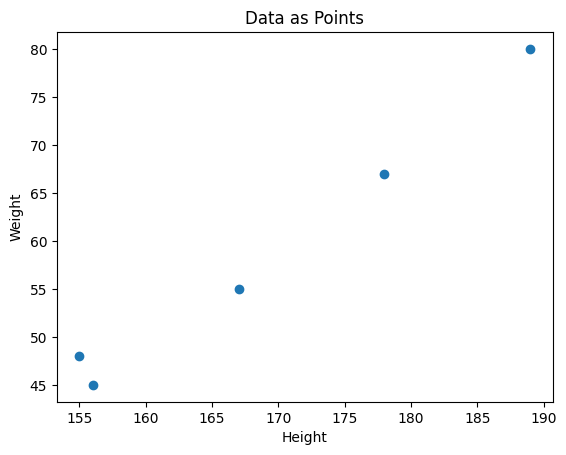
Why uncertainty Exists
Before we measure, wo do not know the value, if we randomly choose a person, their height is unknown.
Key idea:
real-world measurements are uncertain before observation.
Random variable
A random variable describes a quantity whose value is unknown before we observe it.
Key idea:
Random variable = generator
Data = outcome
We observe one value, but it could be been different.
Connecting Everything
Now we can connect those main ideas in this chapter.
A variable describes what we want to measure, such as height, weight, or age.
When we observed one values of a variable, we obtain data. For example, if we measure one person’s height and record 170, then 170 is data, while Height is the variable.
In practice, we usually collect more than one observation. If we measure height and weight for many people, each person gives us one pair of values. These pairs can be written as points on a scatter plot.
This is where an core idea appears:
A dataset is not just a list of numbers.
it is a collection of observation with structure.